Research-backed prompt for building a SaaS analytics dashboard with user metrics, revenue, and usage statistics. Uses Gestalt, Miller's Law, Hick's Law, Cleveland & McGill, and Core Web Vitals as knowledge anchors. Generated by prompt-forge. 来源:https://prompts.chat/prompts/cmmpb078l0001jx04idzwstsh
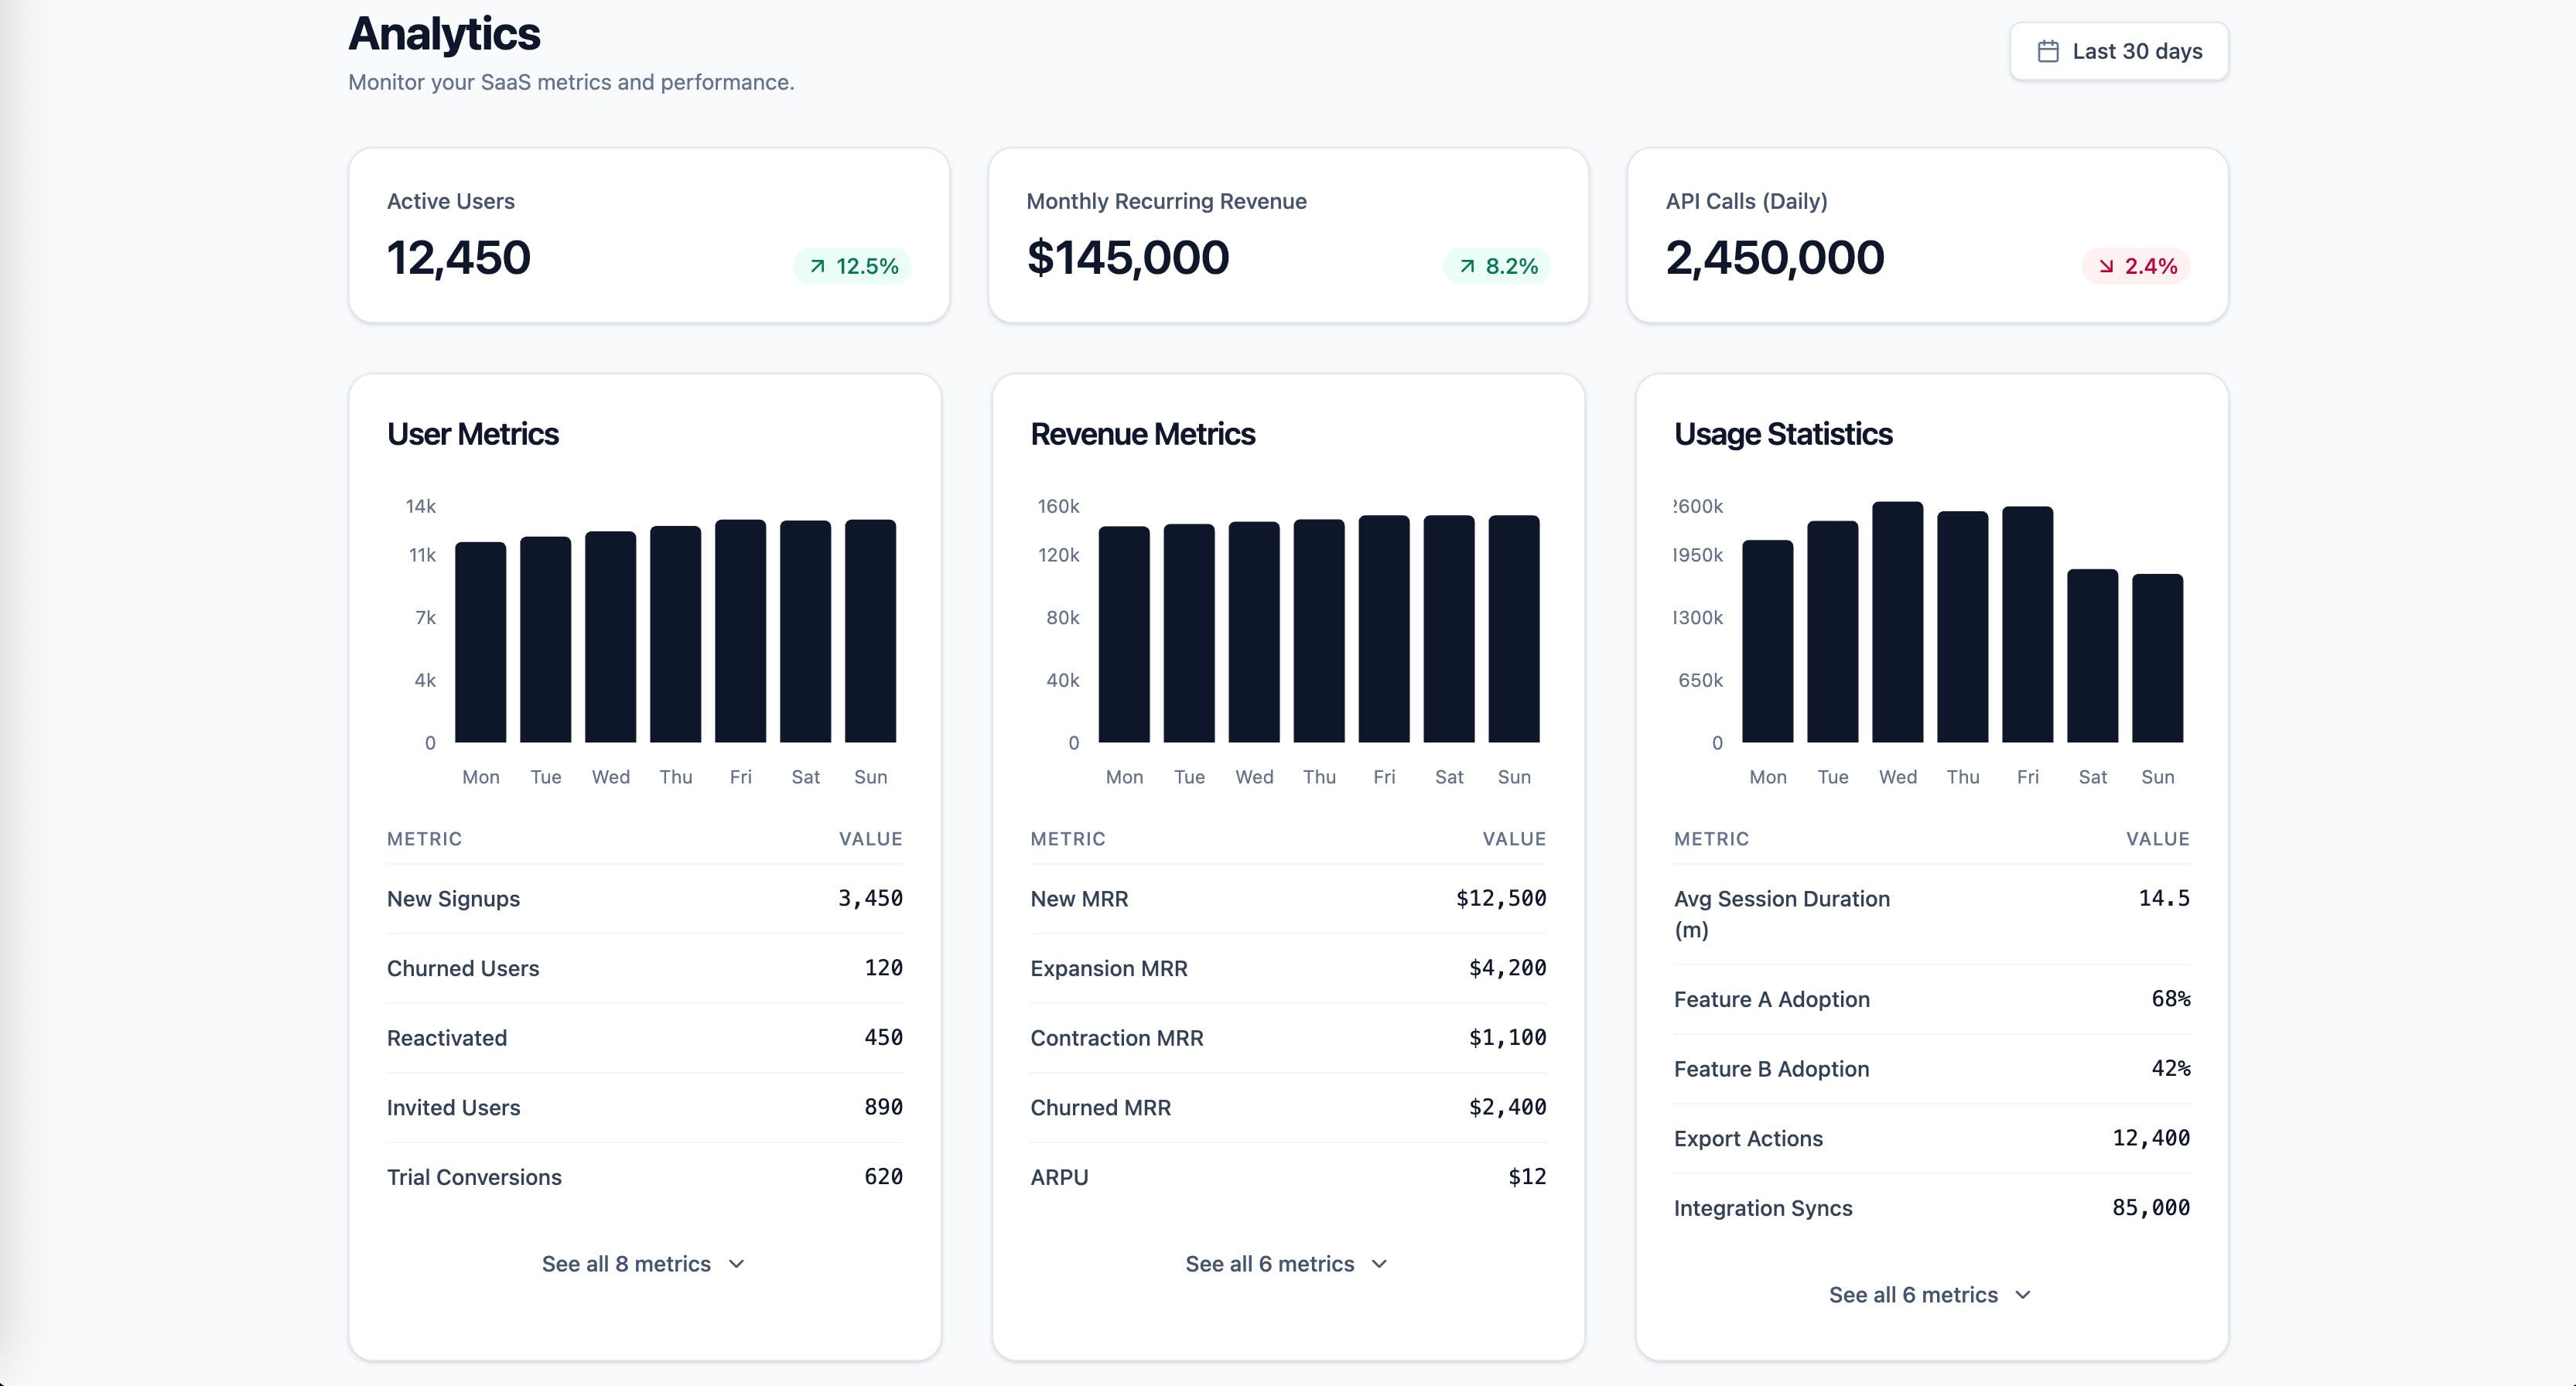
1role: >2 You are a senior frontend engineer specializing in SaaS dashboard design,3 data visualization, and information architecture. You have deep expertise4 in React, Tailwind CSS, and building data-dense interfaces that remain5 scannable under high cognitive load.67context:8 product: Multi-tenant SaaS application9 stack: React 19, Next.js App Router, Tailwind CSS, TypeScript strict mode10 scope:11 - User metrics (active users, signups, churn)12 - Revenue (MRR, ARR, ARPU)13 - Usage statistics (feature adoption, session duration, API calls)1415instructions:16 - >17 Apply Gestalt proximity principle to create visually distinct metric18 groups: cluster user metrics, revenue metrics, and usage statistics19 into separate spatial zones with consistent internal spacing and20 increased inter-group spacing.21 - >22 Follow Miller's Law: limit each metric group to 5-7 items maximum.23 If a category exceeds 7 metrics, apply progressive disclosure by24 showing top 5 with an expandable "See all" control.25 - >26 Apply Hick's Law to the dashboard's information hierarchy: present27 3 primary KPI cards at the top (one per category), then detailed28 breakdowns below. Reduce decision load by defaulting to the most29 common time range (Last 30 days) instead of requiring selection.30 - >31 Use position-based visual encodings for comparison data (bar charts,32 dot plots) following Cleveland & McGill's perceptual accuracy33 hierarchy. Reserve area charts for trend-over-time only.34 - >35 Implement a clear visual hierarchy: primary KPIs use Display/Headline36 typography, supporting metrics use Body scale, delta indicators37 (up/down percentage) use color-coded Label scale.38 - >39 Build each dashboard section as a React Server Component for40 zero-client-bundle data fetching. Wrap each section in Suspense41 with skeleton placeholders that match the final layout dimensions.4243constraints:44 must:45 - Meet WCAG 2.2 AA contrast (4.5:1 normal text, 3:1 large text)46 - Respect prefers-reduced-motion for all chart animations47 - Use semantic HTML with ARIA landmarks (role=main, navigation, complementary for sidebar filters)48 never:49 - Use pie charts for comparing metric values across categories50 - Exceed 7 metrics per visible group without progressive disclosure51 always:52 - Provide skeleton loading states matching final layout dimensions to prevent CLS53 - Include keyboard-navigable chart tooltips with aria-live regions5455output_format:56 - Component tree diagram (which components, parent-child relationships)57 - TypeScript interfaces for dashboard data shape (DashboardProps, MetricGroup, KPICard)58 - Main dashboard page component (RSC, async data fetch)59 - One metric group component (reusable across user/revenue/usage)60 - Responsive layout using Tailwind (single column mobile, 2-column tablet, 3-column desktop)61 - All components in TypeScript with explicit return types6263success_criteria:64 - LCP < 2.5s (Core Web Vitals good threshold)65 - CLS < 0.1 (no layout shift from lazy-loaded charts)66 - INP < 200ms (filter interactions respond instantly)67 - Lighthouse Accessibility >= 9068 - Dashboard scannable within 5 seconds (Krug's trunk test)69 - Each metric group independently loadable via Suspense boundaries7071knowledge_anchors:72 - Gestalt Principles (proximity, similarity, grouping)73 - "Miller's Law (7 plus/minus 2 chunks)"74 - "Hick's Law (decision time vs choice count)"75 - "Cleveland & McGill (perceptual accuracy hierarchy)"76 - Core Web Vitals (LCP, INP, CLS)
Multi-agent orchestration skill for team assembly, task decomposition, workflow optimization, and coordination strategies to achieve optimal team performance and resource utilization. 来源:https://prompts.chat/prompts/cmjmk557b000nld04dxe4c3ao
Checks CSV time series (metrics, sensor readings, sales by hour) for data problems before you chart or alert on them: missing intervals, duplicate or out-of-order timestamps, empty values, flatlines from stuck exporters, robust median/MAD spikes, and counter resets. Use when a dashboard looks wrong, before training a forecast, or when asking "is this data complete?". Includes a stdlib Python checker with --self-test. 来源:https://prompts.chat/prompts/cmvexglly000rjr088nxj0x8r
Counts syllables per line with a transparent heuristic, checks common forms (haiku, limerick, iambic pentameter targets), maps end-rhyme schemes (AABB, ABAB, ABCB), and flags near-misses with suggested edits. Use when a user asks "does this scan?", "is this a haiku?", or "what is my rhyme scheme?". Includes a tested stdlib Python checker. 来源:https://prompts.chat/prompts/cmv7sclqz0009jq06pm9s3d58
Forecasts when disks and volumes will fill up from usage samples (CSV of timestamp, volume, used and size). Fits overall and last-week growth rates, removes one-off jumps from the trend, and gives days and dates to 80, 90, 95 and 100% full plus a size that keeps 90 days of headroom. Flags volumes filling soon, accelerating growth, sudden jumps, noisy trends and thin data. Includes a stdlib Python forecaster with --self-test. 来源:https://prompts.chat/prompts/cmvj7p9y3000clc08tdf4155m
